Note
Click here to download the full example code
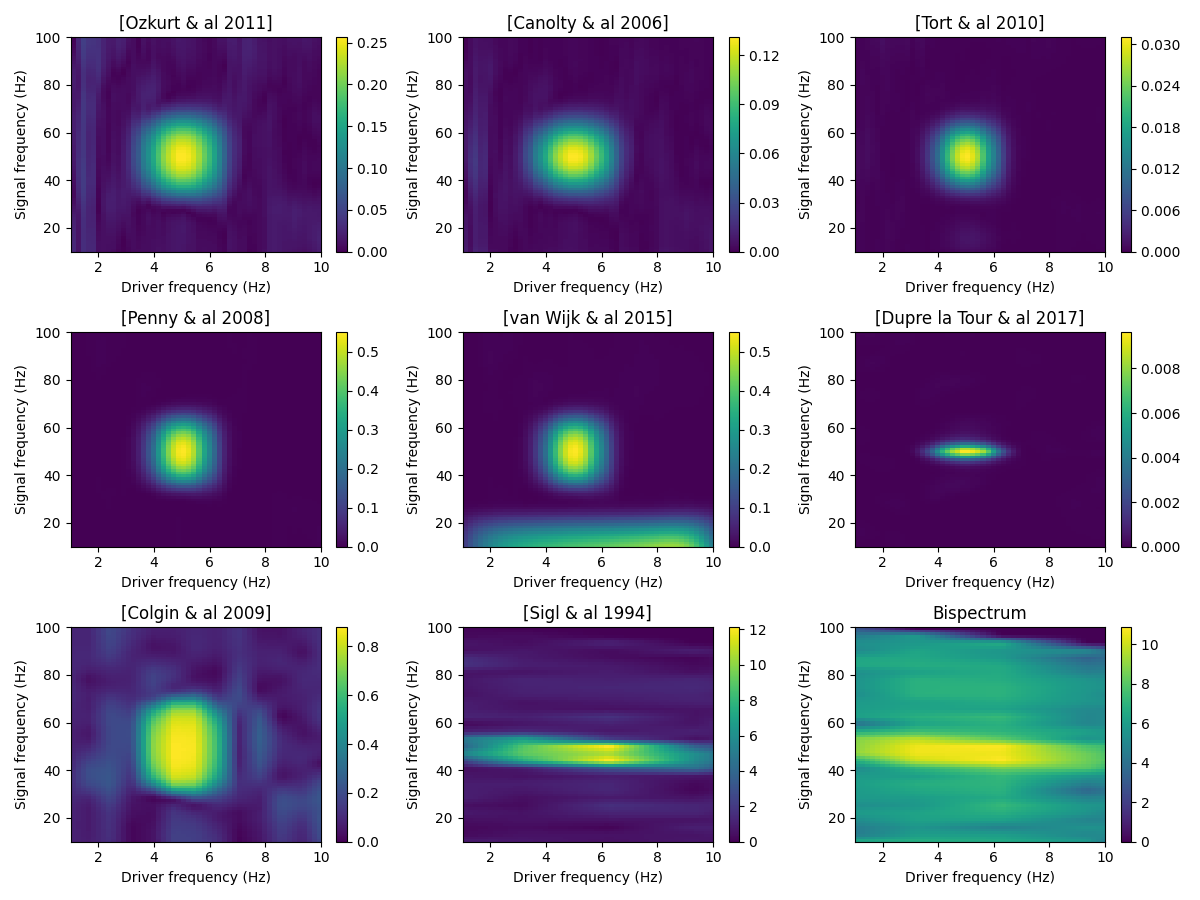
Comodulogram
This example creates an artificial signal with phase-amplitude coupling (PAC) and computes comodulograms with several methods.
A comodulogram shows the estimated PAC metric on a grid of frequency bands.
import numpy as np
import matplotlib.pyplot as plt

from pactools import Comodulogram, REFERENCES
from pactools import simulate_pac
Let’s first create an artificial signal with PAC.
fs = 200.  # Hz
high_fq = 50.0  # Hz
low_fq = 5.0  # Hz
low_fq_width = 1.0  # Hz

n_points = 10000
noise_level = 0.4

signal = simulate_pac(n_points=n_points, fs=fs, high_fq=high_fq, low_fq=low_fq,
                      low_fq_width=low_fq_width, noise_level=noise_level,
                      random_state=0)
Then, let’s define the range of low frequency, and the list of methods used
low_fq_range = np.linspace(1, 10, 50)
methods = [
    'ozkurt', 'canolty', 'tort', 'penny', 'vanwijk', 'duprelatour', 'colgin',
    'sigl', 'bispectrum'
]
To compute the comodulogram, we need to instanciate a Comodulogram object, then call the method fit. The method plot draws the results on the given subplot axes.
# Define the subplots where the comodulogram will be plotted
n_lines = 3
n_columns = int(np.ceil(len(methods) / float(n_lines)))
fig, axs = plt.subplots(
    n_lines, n_columns, figsize=(4 * n_columns, 3 * n_lines))
axs = axs.ravel()


# Compute the comodulograms and plot them
for ax, method in zip(axs, methods):
    print('%s... ' % (method, ))
    estimator = Comodulogram(fs=fs, low_fq_range=low_fq_range,
                             low_fq_width=low_fq_width, method=method,
                             progress_bar=False)
    estimator.fit(signal)
    estimator.plot(titles=[REFERENCES[method]], axs=[ax])

plt.show()
Out:
ozkurt...
canolty...
tort...
penny...
vanwijk...
duprelatour...
colgin...
sigl...
bispectrum...
/home/tom/work/github/pactools/examples/plot_comodulogram.py:62: UserWarning: Matplotlib is currently using agg, which is a non-GUI backend, so cannot show the figure.
  plt.show()
Total running time of the script: ( 0 minutes 13.248 seconds)