pactools.PeakLocking
-
class
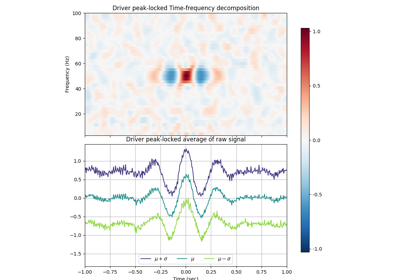
pactools.PeakLocking(fs, low_fq, low_fq_width=1.0, high_fq_range='auto', high_fq_width='auto', t_plot=1.0, filter_method='pactools', peak_or_trough='peak', percentiles=['std+', 'mean', 'std-'])[source]¶ An object to compute time average and time-frequency averaged with peak-locking, to analyze phase-amplitude coupling.
- Parameters
- fsfloat
Sampling frequency
- low_fqfloat
Filtering frequency (phase signal)
- low_fq_widthfloat
Bandwidth of the band-pass filter (phase signal)
- high_fq_rangearray or list, shape (n_high, ), or ‘auto’
List of filtering frequencies (amplitude signal) If ‘auto’, it uses np.linspace(low_fq, fs / 2, 40).
- high_fq_widthfloat or ‘auto’
Bandwidth of the band-pass filter (amplitude signal) If ‘auto’, it uses 2 * low_fq.
- t_plotfloat
Time to plot around the peaks (in second)
- filter_methodin {‘mne’, ‘pactools’}
Choose band pass filtering method (in multiple_band_pass) ‘mne’: with mne.filter.band_pass_filter ‘pactools’: with pactools.fir.BandPassFilter (default)
- peak_or_trough: in {‘peak’, ‘trough’}
Lock to the maximum (peak) of minimum (trough) of the slow oscillation.
- percentileslist of float or string, shape (n_percentiles, )
Percentile to compute for the time representation. It can also include ‘mean’, ‘std’ or ‘ste’ (resp. mean, standard deviation or standard error).
-
__init__(self, fs, low_fq, low_fq_width=1.0, high_fq_range='auto', high_fq_width='auto', t_plot=1.0, filter_method='pactools', peak_or_trough='peak', percentiles=['std+', 'mean', 'std-'])[source]¶ Initialize self. See help(type(self)) for accurate signature.
Methods
__init__(self, fs, low_fq[, low_fq_width, …])Initialize self.
fit(self, low_sig[, high_sig, mask])Compute peak-locked time-averaged and time-frequency representations.
plot(self[, axs, vmin, vmax, ylim])- Returns
plot_peaks(self[, ax])